The built in CF debugging information displayed at the bottom of every page is very useful. But there are times where it doesn’t work very well. For example, any time you are using a framework, or where you are passing content around to CFC methods. Any data passed to a CFC method will be shown in the standard debugging information. This can cause havoc if the content contains some JavaScript. I use the datatables jQuery plugin on my site, so I have some JavaScript calls that turn a regular HTML table into a “datatable”. But when debugging info is on, this JavaScript code can get run several times, since the browser doesn’t know to ignore the JavaScript listed in the debugging information. This causes problems.
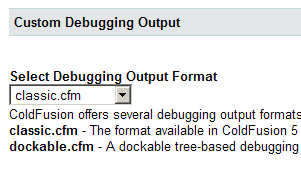
So I have an interest in getting rid of some of the info, but I do want some of it, mainly the queries. Its actually very easy to customize the ColdFusion debugging information. In the ColdFusion administrator, under the Debugging Output Settings menu there is a drop down to select the debugging format.

The files listed here are the contents of the C:\ColdFusion9\wwwroot\WEB-INF\debug directory. To create a custom debugging output all you need to do is drop a new file in this directory. Start with an existing one and customize it to your needs.
Here is one I’ve created that only shows database queries: Download queriesOnly.cfm

