I was working on converting an application from ColdFusion 5 to CFMX 7 last week, and ran into some problems converting cfgraph (CF5) to cfchart (CF7). The graphs that looked nice in 5 weren’t coming out so good in 7.
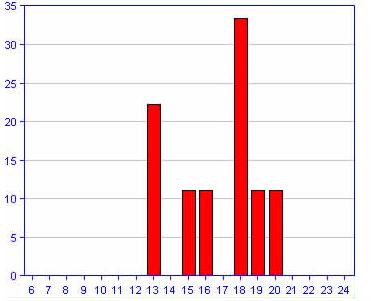
Original chart in CF5, using the CFGraph tag:
How the chart looks after converting to CFChart in CF7
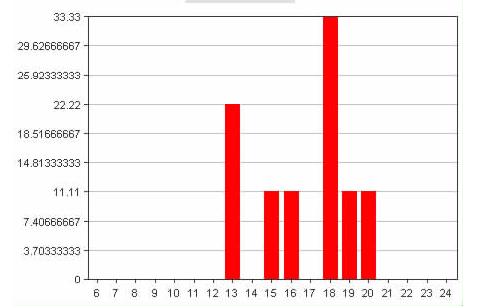
Notice the problem with the y-axis labels.
The cfchart code looks like this:
<cfchart
	 format = "JPG"
	 chartWidth = "450"
	 chartHeight = "350"
	 title = "Aggregate Scores"
	 scaleFrom = "0"
	 scaleTo = "#Val(ArrayMax(aryPercentages))#"
	 gridLines = "10"
	 >
	<cfset arrayindex = 0>
	<cfchartseries seriescolor="red" type="bar">
		<cfloop from="6" to="24" index="i">
			<cfset arrayindex = arrayindex + 1>
			<cfchartdata item="#i#" value="#aryPercentages[arrayindex]#">
		</cfloop>
	</cfchartseries>
</cfchart>
The answer to this problem is that your gridLines and scaleTo values must be related. The scaleTo value must be evenly divisible by (gridLines – 1). So my fix was:
<cfscript>

gridLines = 10;

scaleTo = Val(ArrayMax(aryPercentages));

while ( scaleTo mod (gridLines - 1) NEQ 0) { scaleTo = scaleTo + 1;}

</cfscript>
When setting scaleTo, that should be the maximum value you are graphing. Here my data is in an array so I use ArrayMax. Then just use the gridLines and scaleTo variables in your cfchart tag. If you ever want to change the number of gridlines, just change the declaration in the cfscript block, and the rest will work itself out.

maramandan says:
Hi Ryan
I have a normal chart ( type="horizontalbar") Is there any way by which I could put the X axis on the top ? Sort of like primaryXAxisplacement = Top|Bottom. I didn't find this setting in CF 8 / WebCharts3D 5.1. Any Idea how this could be done? Please help me
Thanks in Advance
23 February 2010, 5:40 amGaidzag Shahbazian says:
Please advice me to convert the following code from CF5 to CF7. Thanks
<!— Display The Graph —>
9 November 2010, 12:45 pm<APPLET CODE="BarChart.class" CODEBASE="/classes/CFGraphs/" WIDTH="450" HEIGHT="250">
<!— Set required record set parameters —>
<CFOUTPUT>
<PARAM NAME="ChartData.Columns" VALUE="Items,Values,Colors">
<PARAM NAME="ChartData.Items" VALUE="#ValueList(GetDeputyQuery.ComplaintDeputy)#">
<PARAM NAME="ChartData.Values" VALUE="#ValueList(GetDeputyQuery.CountofComplaintDeputy)#">
<PARAM NAME="ChartData.Colors" VALUE="red,blue,green,yellow,magenta,cyan,orange,pink,darkgray,red,blue,green,yellow,magenta,cyan,orange,pink,darkgray">
</CFOUTPUT>
<!— Set the optional display parameters —>
<PARAM NAME="Title" VALUE="Deputy">
<PARAM NAME="TitleFontName" VALUE="Arial">
<PARAM NAME="TitleFontHeight" VALUE="9">
<PARAM NAME="DebugInfoEnabled" VALUE="yes">